Cash Flow S-Curve Explained (and Why Contractors Get It Wrong)
 BoqCalc Team
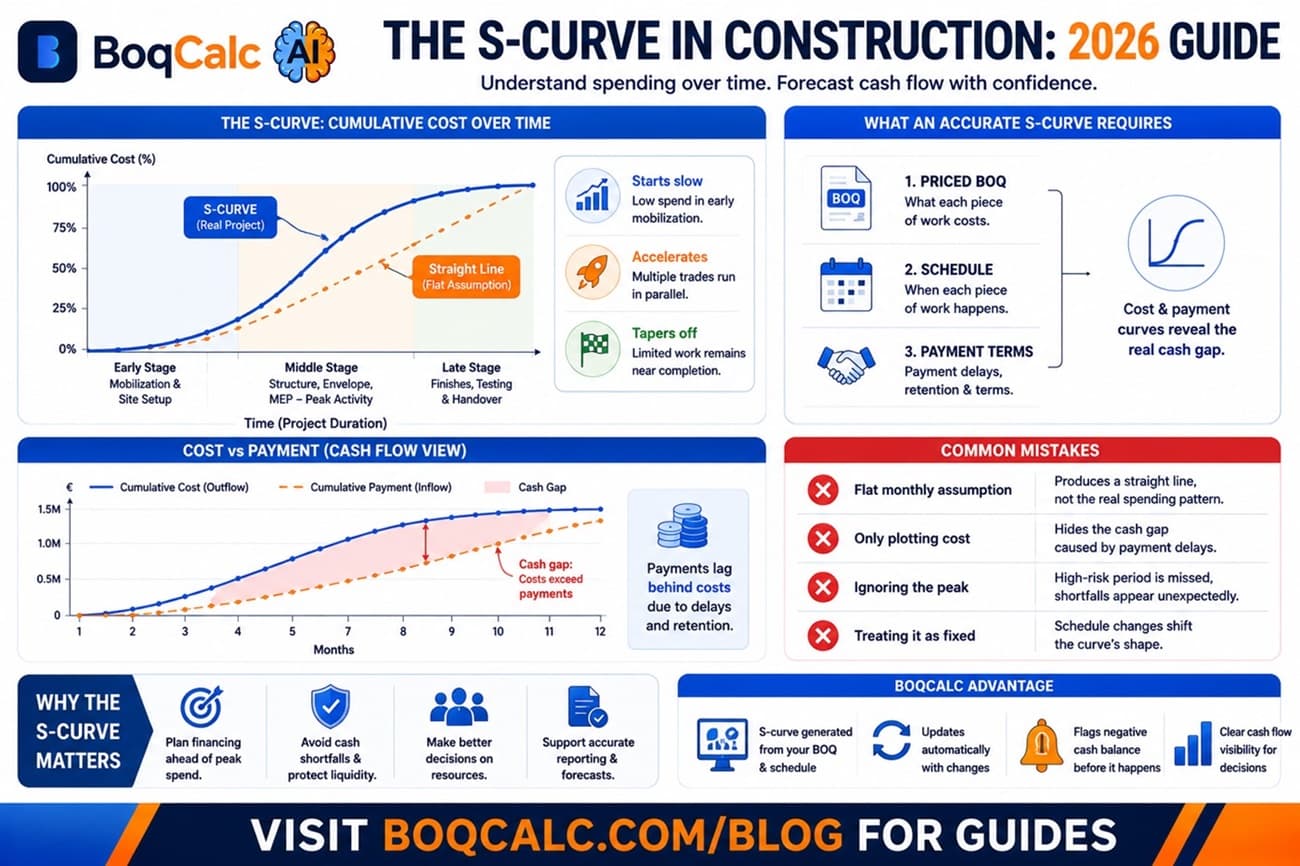
Plot cumulative cost against time on almost any real construction project and the line isn't straight. It starts slow, accelerates through the middle, then tapers off again near completion. That shape has a name: the S-curve, and understanding why it looks that way, not just that it does, is what separates a useful cash flow forecast from a rough guess.
Why Spending Follows an S-Shape, Not a Straight Line
A project doesn't spend money at a constant rate. Early on, activity is limited to mobilization, site setup, and early groundworks, so spend is low. Through the middle of the project, multiple trades run in parallel: structure, envelope, and MEP often overlap, and spend accelerates sharply. Near the end, remaining work narrows to finishes, snagging, and commissioning, so spend tapers off again.
Dividing the total project cost evenly across the project duration produces a straight diagonal line. It's the easiest forecast to build and also the least accurate one, because it assumes a constant spending rate that essentially never happens on a real project.
What the S-Curve Actually Requires to Build
An accurate S-curve needs the same three inputs as any real cash flow forecast:
- The priced BOQ. What each piece of work costs.
- The schedule. When each piece of work happens, which is what actually creates the curve's shape. Without a real schedule, there's no way to know when the middle-of-project spending spike happens, only that it eventually does.
- Payment terms. How long after work is completed the payment arrives, plus retention held back until later.
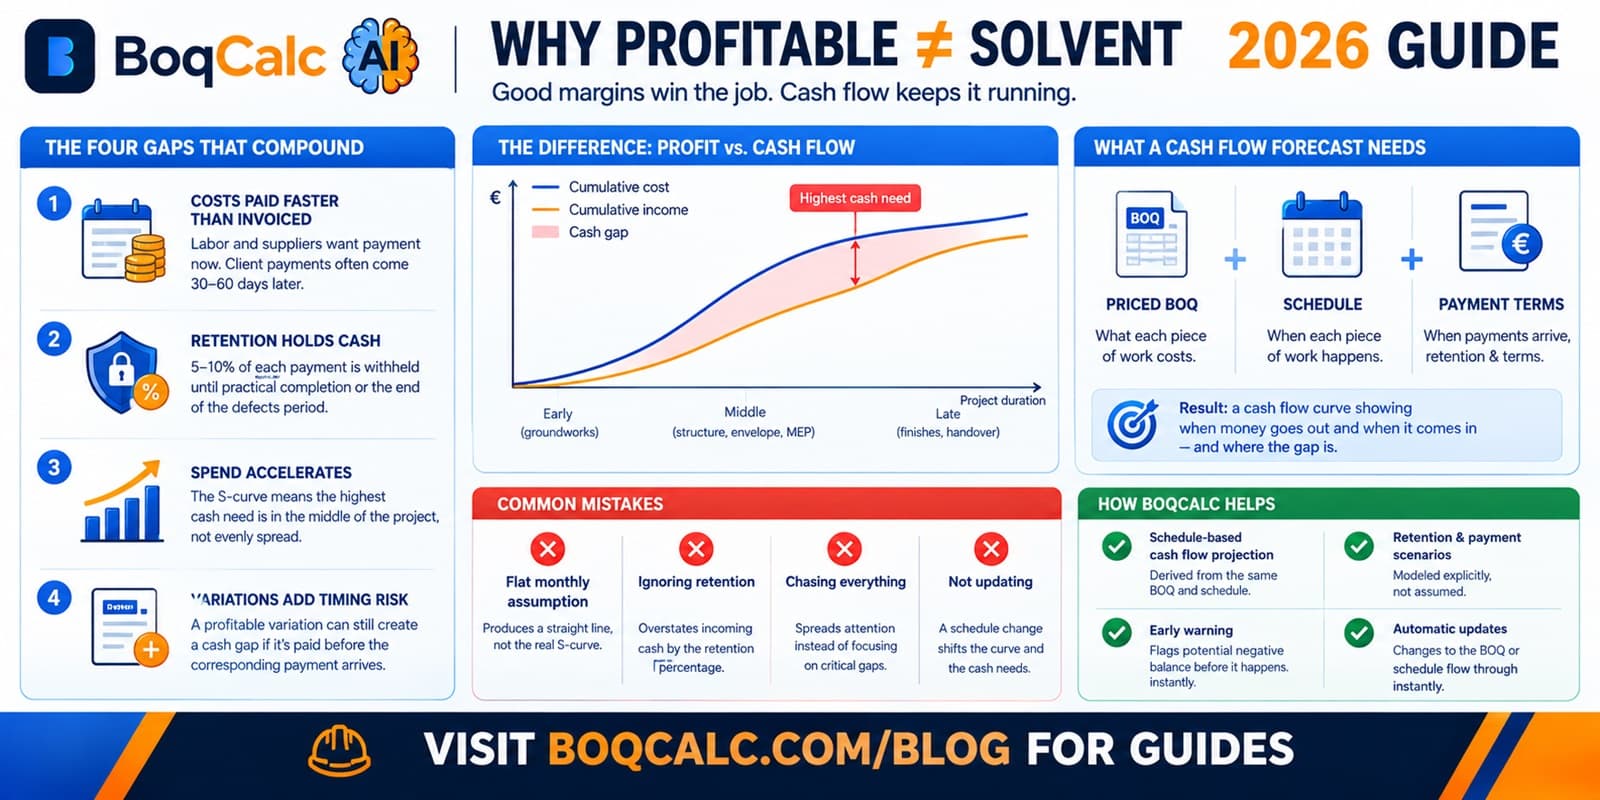
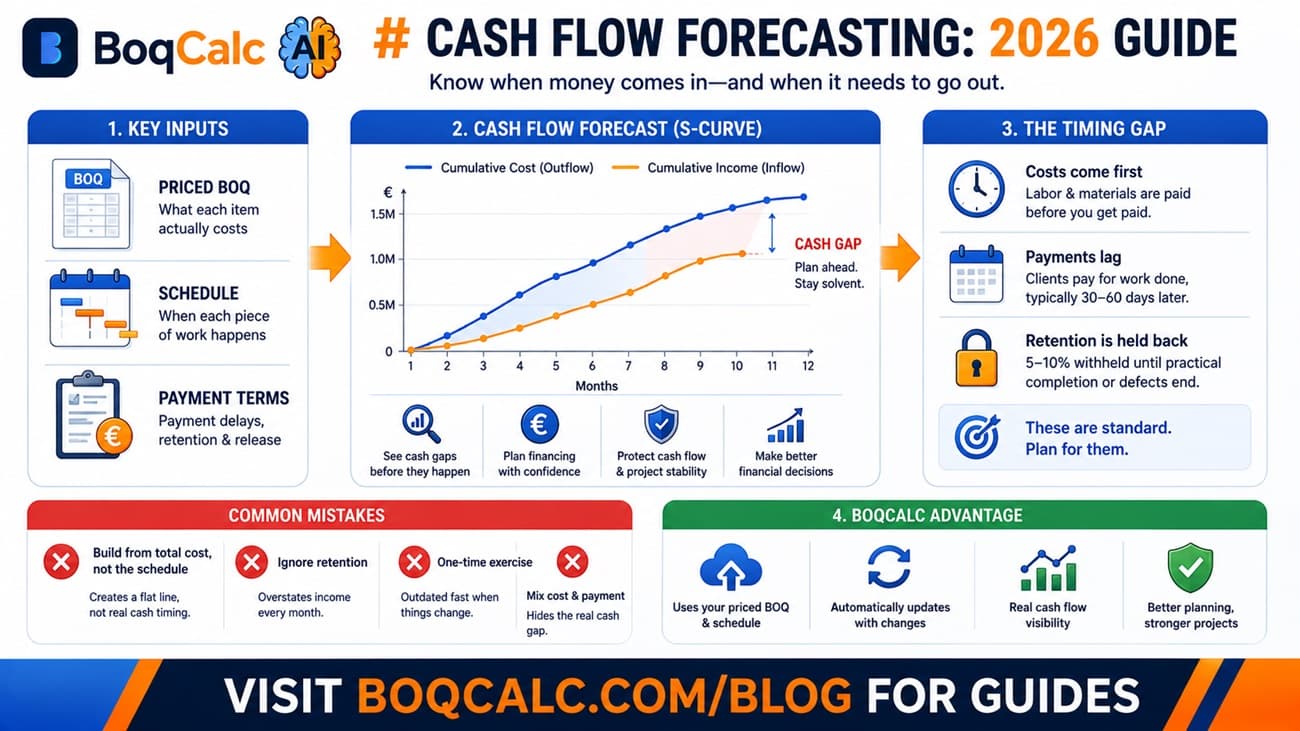
The cost curve and the payment curve are related but not identical. Payments lag behind costs because of invoicing and certification delays, and retention holds back a further slice until much later. Plotting both curves together, not just the cost side, is what reveals the actual cash gap: the period where money is going out faster than it's coming in.
Where Contractors Get the S-Curve Wrong
Building it from a flat percentage-per-month assumption. A common shortcut is applying a rough percentage of total cost to each month based on general experience rather than this project's actual schedule. It produces a curve that looks plausible but doesn't reflect when this specific project's spend actually peaks.
Only plotting cost, never payment. A cost-only S-curve tells you what's being spent. It doesn't tell you whether incoming payments are keeping pace, which is the actual question a cash flow forecast exists to answer.
Ignoring where the peak actually falls. The steepest part of the curve, usually during structure and envelope trades, is where financing needs are highest. A forecast that doesn't clearly flag that peak leaves a contractor discovering the shortfall in real time instead of planning for it.
Treating the curve as fixed once drawn. A schedule slip shifts the curve's shape, not just its endpoint. An S-curve built at tender stage and never revisited stops describing the actual project the moment the schedule changes materially.
Why This Connects Back to the Schedule
An S-curve is really a cost curve wearing a schedule's shape. Without an accurate schedule behind it, an S-curve is a plausible-looking guess rather than a genuine forecast. This is why cash flow forecasting and scheduling aren't really separate problems: one determines the shape of the other. See our guide to construction cash flow forecasting for the broader forecasting process this curve fits into.
How BoqCalc Handles This
BoqCalc generates the cash flow S-curve directly from the same priced BOQ and schedule used for cost estimation, so the curve's shape reflects this project's actual sequencing rather than a flat monthly assumption. Payment scenarios and retention are modeled alongside the cost curve, and the projection flags where a negative balance is likely before it happens on site, not after.
Frequently Asked Questions
Is the S-curve always the same shape? The general slow-fast-slow pattern is typical, but the exact steepness and timing of the peak depend entirely on this project's specific schedule and trade sequencing. Two projects of similar total value can have meaningfully different curves.
What's the difference between a cost S-curve and a cash flow S-curve? A cost S-curve shows cumulative spend over time. A cash flow view adds the payment side, showing when money actually arrives against when it's spent, which is what reveals the funding gap.
Can an S-curve be built without a detailed schedule? Only as a rough approximation. Without real sequencing data, the curve is an educated guess at shape rather than a calculation, and its accuracy at any individual point in time is limited.
Why does the peak of the curve matter so much? Because it's the point of maximum financing need. Knowing roughly when and how large that peak is lets a contractor arrange financing or manage supplier payment terms in advance, rather than reacting to a shortfall after it appears.
Conclusion
The S-curve isn't a stylistic choice. It's the mathematical result of how construction spending actually accelerates and tapers as trades overlap and then wind down. A forecast that skips the schedule and assumes a straight line isn't simplifying the problem, it's answering a different, less useful question.
BoqCalc Team
From the BoqCalc team
Ready to price your next BOQ?
4 free credits, no credit card. Upload a BOQ and see the cost estimate, risk analysis, schedule, and cash flow for yourself.
Try BoqCalc free →